Here is a quote from the Second ICES/NASCO Workshop on Salmon Mortality at Sea held in 2022: “No agreement on the development of a set of priority marine mortality hypotheses was reached.” Translated this means the fisheries bods can’t make up their minds on the most likely cause of salmon vanishing at sea. The document goes on to expound, in the usual opaque language, about ‘complexities’, lack of data, particularly data from commercial fisheries; looking forward, the workshop agreed on the need for ‘cooperative initiatives’, ‘standardised approaches’, blah blah blah — i.e. the bullshit approach I’ve written about before.
The one encouragement is the recognition that information on commercial fishing is lacking, although this refers to bycatch data and makes no mention of possible illegal fishing, certainly an obvious contender for the salmon’s steep decline. The whole report is a waffle-fest of generalisations, wishlists and boilerplating. Even if any of the contents can be converted into something concrete, it will take years, and salmon stocks don’t have years. Looking through the list of authors, I am surprised to see some whom I believe to be competent scientists. Not sure I’d want to put my name to such a flimsy bit of work but then getting your name on as many papers as possible is the name of the game these days. Sophie Elliott has emphasised the importance of commercial capture data but there is no such emphasis in the ICES doc. Colin Bull, on the other hand, has proved himself a principal waffle merchant already.
So is there anything going on in the fisheries research community besides fretting over priority mortality hypotheses. Well, looking through the Atlantic Salmon Trust’s 2025 review, most of it looks to be examining fingernails. Yes, some is interesting and of potential long term benefit, if there is to be a long term for salmon, but only the section on Elliott’s bycatch work addresses the immediate concern. The Save the Spring project, which artificially rears smolts to adulthood, has reached a ‘major milestone’ — 75 fish released into the River Muick, a tributary of the Dee. Will it boost the spring fish population? Too early to tell.
Lest you think fisheries scientists are only hard-nosed seekers of knowledge, the AST report has a heartwarming tale about a tagged fish called Lax (ahh, cute) on its journey from parr to spawner. Apparently Lax was one of thousands tagged but we’re not told how many came back. Other data suggest a few dozen at best.
The Game and Wildlife Conservancy Trust publishes its latest work here . The results of work on the River Frome in Dorset apparently mirrors declines all over the country, although the estimates show wide variation, for which there is no explanation. Clearly the means of estimation is not entirely trustworthy and it’s worth noting that the pattern of decline for the past 15 years is not overwhelming; only in the last couple of years is there a more obvious fall.

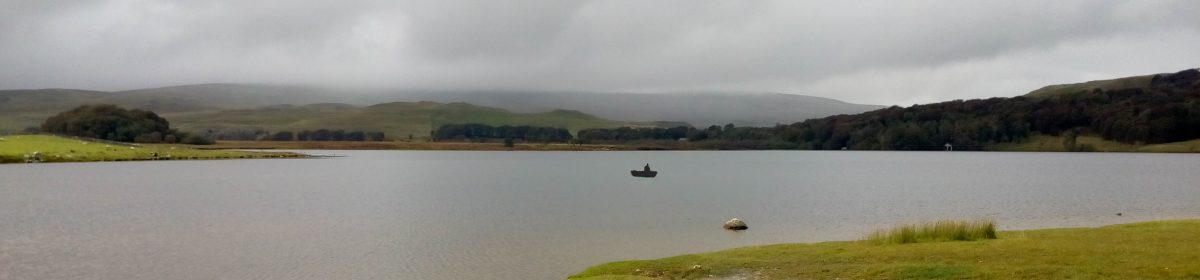
What of the Moray Tracking Project I mentioned two years ago? Still analysing data according to the AST website . Whatever the outcome of this, I don’t expect the work will do much for salmon numbers. My bet is still on commercial fishing, illegal or accidental, being the main culprit. As I’ve said before, marine species worldwide are dwindling due to fishing pressure; no priority hypotheses needed to know that. It’s eminently logical that salmon populations are collapsing for the same reason. Just because legal fisheries have ended doesn’t mean such a commercially valuable fish is left alone. If this is indeed true, then in a sense it is good news because something can conceivably be done about it. Pacific salmon fisheries are policed and these are in good health, or at least better health than Atlantic populations. But if the problem is more complex, the effect of global warming on the marine ecosystem perhaps, I see little prospect of solving that in time to save the salmon. I’m not sure we will even save ourselves.
Where Atlantic salmon stocks are concerned, the scientists are right to resist the general clamour to use hatcheries to boost declining wild stocks because that only hastens their destruction. Specialised intervention like Save the Spring may help but I’m not expecting much. Most of present research seems to me to be navel-gazing with any benefits always a long way down the river. The scientists are neither heroes nor zeroes, but they may just be Neroes fiddling away while the bonfire of greed consumes the last of our wild salmon.
